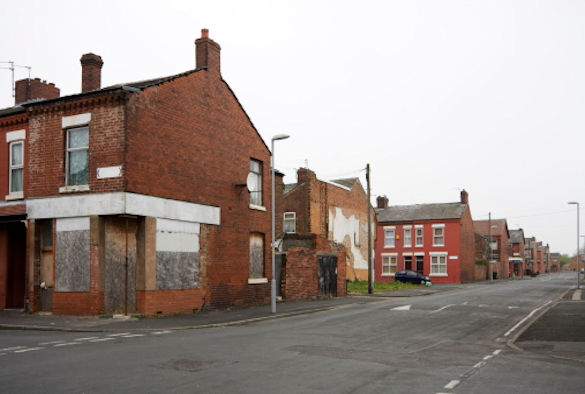
A new study of census data by the University of Liverpool, has found that Glasgow tops the list of the most deprived areas over the period 1971 – 2011 but deprivation in urban areas remains consistently high, and is spreading further out.
The study uses a new data resource – PopChange – which provides census data for 1km by 1km areas, providing a new level of insight into changing population levels which has not been available previously.
Researchers analysed data from the 1971 to 2011 censuses relating to levels of unemployment, the percentage of households living in rented or overcrowded households (more than one person per room) and access , or not, to a car.
Over the 40 year period as whole, they found that all of the top ten most deprived areas in Britain (with the largest average deprivation score) were in Glasgow.
The data reveals that certain wards on the outskirts of London showed an increase in deprivation over every ten year period and, in the capital as a whole, absolute deprivation in 2011 was greater than in any other census year.
Whilst there were large increases in deprivation in all urban areas including Newcastle, Manchester, Liverpool and Birmingham, they also noted a strong trend of deprivation spreading from urban areas to the fringes of these areas, and an increase in the urban-rural divide in deprivation.
In 2011, the most deprived areas in Britain as a whole were in parts of Birmingham, Stockton-on-Tees, Redcar and Cleveland, Bradford, Birmingham and Glasgow.
Chris Lloyd, Professor of Quantitative Geography at the University of Liverpool’s Department of Geography & Planning, said: “These findings show just how persistent deprivation is, and they also show how concentrations of deprivation in urban areas are actually growing.”
“The study shows that the experience of people living in deprived areas can be very different; in some neighbourhoods, high levels of deprivation are all that residents have known, while in others a combination of population change within areas and migration into and out of these areas, as well as economic fluctuations, mean that levels of deprivation have increased markedly in recent years.
PopChange is a freely available resource which can be used by the public, data officers, local and central government, and planners to analyse and map population changes in 1km by 1km areas over the last five Censuses.
PopChange was developed with support from the Economic and Social Research Council through the Secondary Data Analysis Initiative. The project team worked with Clear Mapping Co to create a public web resource (https://popchange.liverpool.ac.uk/) that allows anyone to make population comparisons for small areas across the country. PopChange is based within the University’s Centre for Spatial Demographics Research.
The study `Deprivation Change in Britain’ was co-authored by Professor Chris Lloyd, Dr Gemma Catney, Dr Paul Williamson and Dr Nick Bearman from the University’s Centre for Spatial Demographics Research, and Dr Paul Norman from the University of Leeds.